I recently built a new machine that I plan to use as my main LLM machine. I don't have a high-end graphics processor like the RTX 5090, but even GPUs like the GTX 1070 and RTX 3080 have shown to be quite good for using quantized 7B models.
My last blog post, I shared about the AI assistant application that I built. While I have been using it, the PC running the Jinoah API was running with the GTX 1070. The performance that I was experiencing was acceptable for most things that I would ask it, only taking maximum a few minutes for more complex prompts. After building my new machine, I got curious and wanted to write a performance benchmark to compare the GTX 1070 system with my RTX 3080 system.
Test Specifications
For starters, I'll go over the actual specifications of the systems:
- Old System
- GPU: GTX 1070 (ASUS ROG Strix), 8GB GDDR5 VRAM
- CPU: Ryzen 5 2600
- RAM: 32GB DDR4 at 2133 MT/s
- New System
- GPU: RTX 3080 (ASUS TUF OC), 10GB GDDR6X VRAM
- CPU: Intel i9-14900k
- RAM: 64GB DDR5 at 6000 MT/s
Next, the test uses the dolphin-mistral, a 7B LLM model running on ollama.
Finally, let's go over the test itself. If you read my previous blog post, you will know that I created a client application that calls the Jinoah API running on a server. Specifically, I implemented an HTTP POST /query endpoint. The query endpoint sends a request to the ollama REST API to get a response based on the input prompt. After it has the response, it will then use XTTS2 to produce audio bytes of the response. This is exactly what we are going to test.
For our parameters, I want to do three types of tasks, where a sample is a single time we call the API:
- Short prompt ("Hello."), 1000 samples
- Medium prompt ("What are the benefits of using Python for web development?"), 250 samples
- Long prompt ("Tell me a story."), 100 samples
Here is a high level of my performance script:
for benchmarking_system in benchmarking_systems:
    # Initialize variables based on benchmarking_system
    gpu = benchmarking_system['gpu']
    server_url = benchmarking_system['server_url']
    prompt = benchmarking_system['prompt']
    test_type = benchmarking_system['test_type']
    print(f"Running test for: {gpu} [{test_type}]")

    model = "dolphin-mistral"
    sample_size = 1000

    data = []

    # Perform Test and add result to data
    for i in range(sample_size):
        print(f"Test #{i+1}")
        start_time = time.perf_counter()
        response = llm_client.prompt_api(prompt, server_url=server_url)
        end_time = time.perf_counter()
        latency_ms = (end_time - start_time) * 1000
        data.append({
            "Prompt": prompt,
            "Latency (ms)": latency_ms
        )}
Aftewards, I use pandas to write my data to an Excel sheet and use matplotlib to create the charts below.
Short Prompt Test
This is the test where we simply pass "Hello" as our prompt to the Jinoah API.
Old System
Running with the Old System (GTX 1070) took 53.5 minutes to complete 1000 samples.
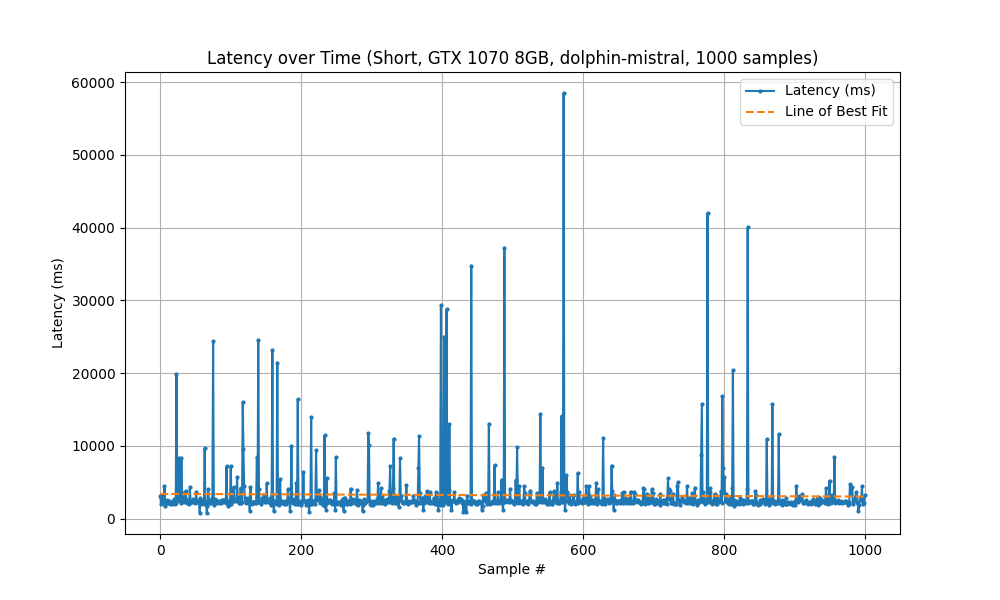
| Statistic | Measured Latency (ms) |
|---|---|
| Mean | 3,213 |
| Min | 769 |
| Max | 58,500 |
New System
Running with the New System (RTX 3080) took 23.3 minutes to complete 1000 samples.
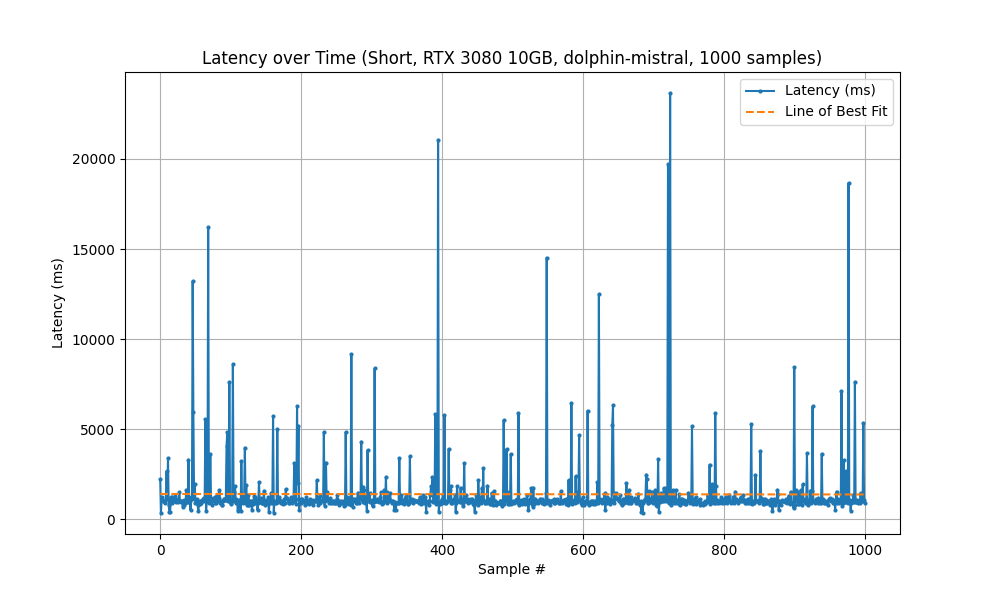
| Statistic | Measured Latency (ms) |
|---|---|
| Mean | 1,396 |
| Min | 354 |
| Max | 23,659 |
Medium Prompt Test
In this test, the input prompt was "What are the benefits of using Python for web development?"
Old System
Running with the Old System (GTX 1070) took 131 minutes to complete 250 samples.
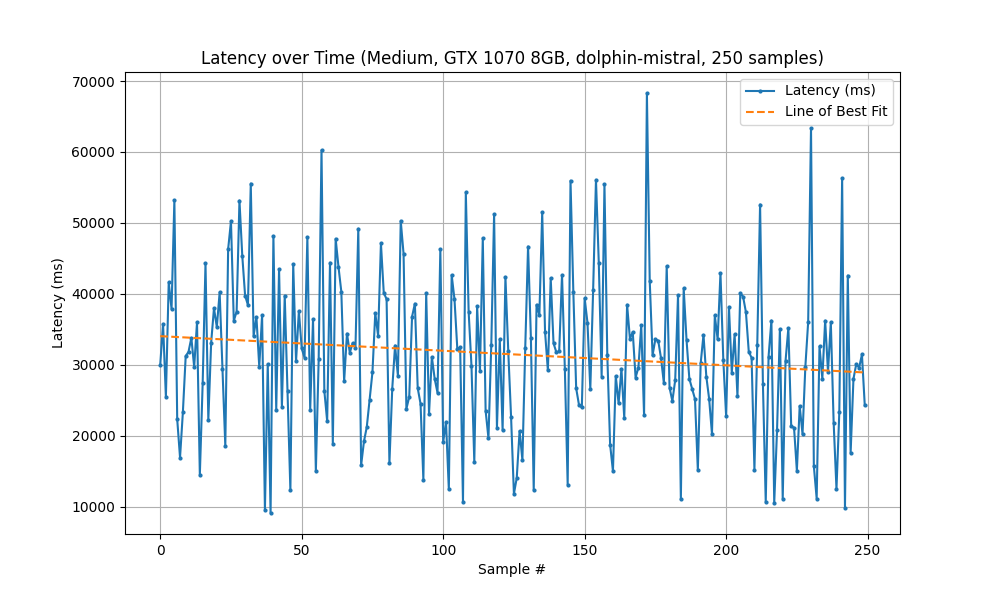
| Statistic | Measured Latency (ms) |
|---|---|
| Mean | 31,494 |
| Min | 9,137 |
| Max | 68,310 |
New System
Running with the New System (RTX 3080) took 59 minutes to complete 250 samples.
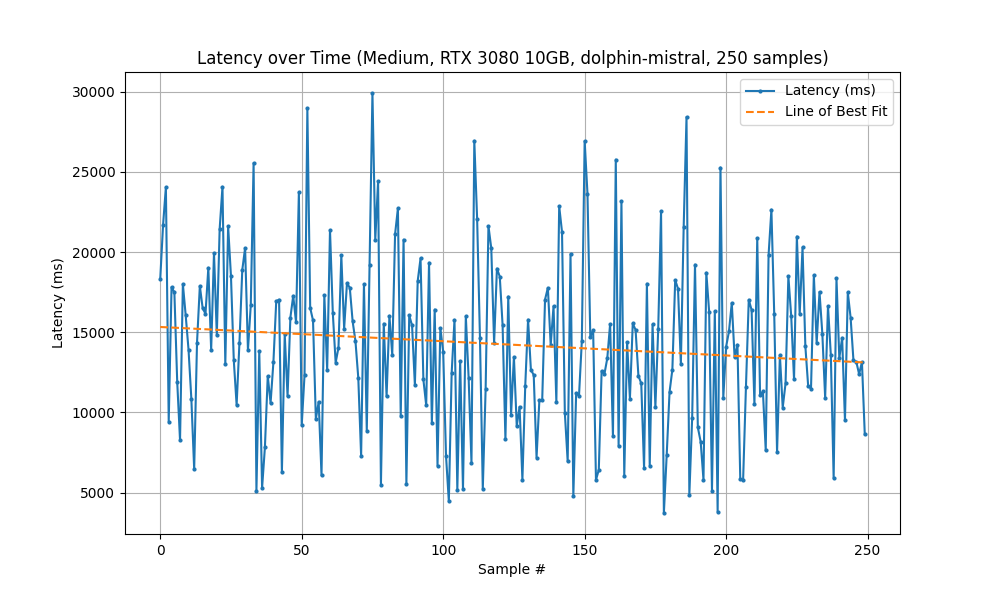
| Statistic | Measured Latency (ms) |
|---|---|
| Mean | 14,225 |
| Min | 3,732 |
| Max | 29,922 |
Long Prompt Test
For the final test, the input prompt was "Generate a short story about a robot learning to love, in the style of Isaac Asimov"
Old System
Running with the Old System (GTX 1070) took 68 minutes to complete 50 samples.
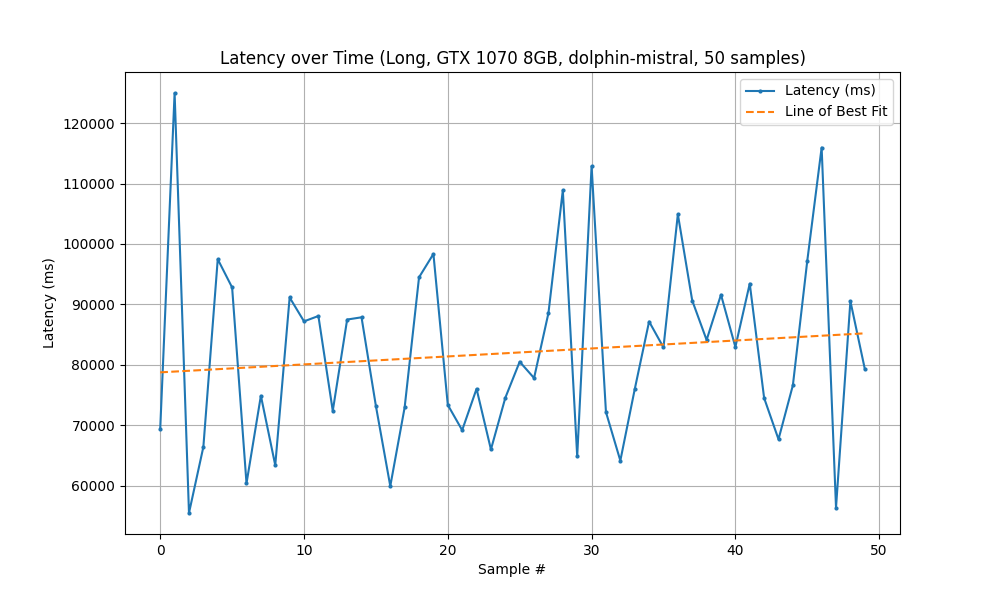
| Statistic | Measured Latency (ms) |
|---|---|
| Mean | 81,981 |
| Min | 55,473 |
| Max | 124,991 |
New System
Running with the New System (RTX 3080) took 27 minutes to complete 50 samples.
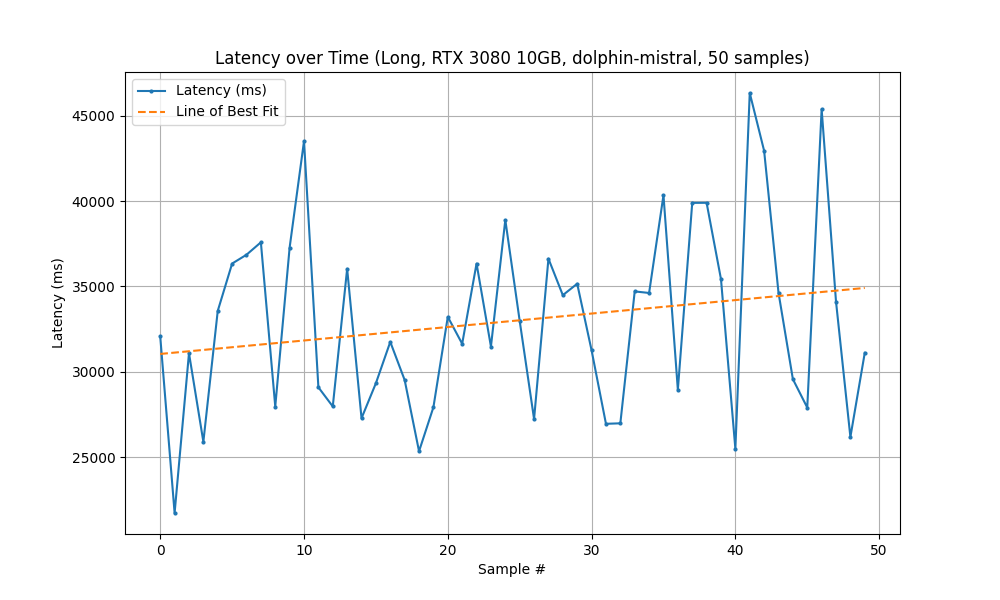
| Statistic | Measured Latency (ms) |
|---|---|
| Mean | 32,974 |
| Min | 21,724 |
| Max | 46,329 |
Analysis
- Consistent Speed Gains: The RTX 3080 delivers between 2.2–2.7× performance gains across all prompt lengths.
- Lower Variability: Standard deviation (based on range) appears tighter in the 3080 system, suggesting more consistent performance and fewer spikes.
- System Scalability: These results imply the newer system can handle higher concurrency or lower throttling margins—ideal for scaling.